

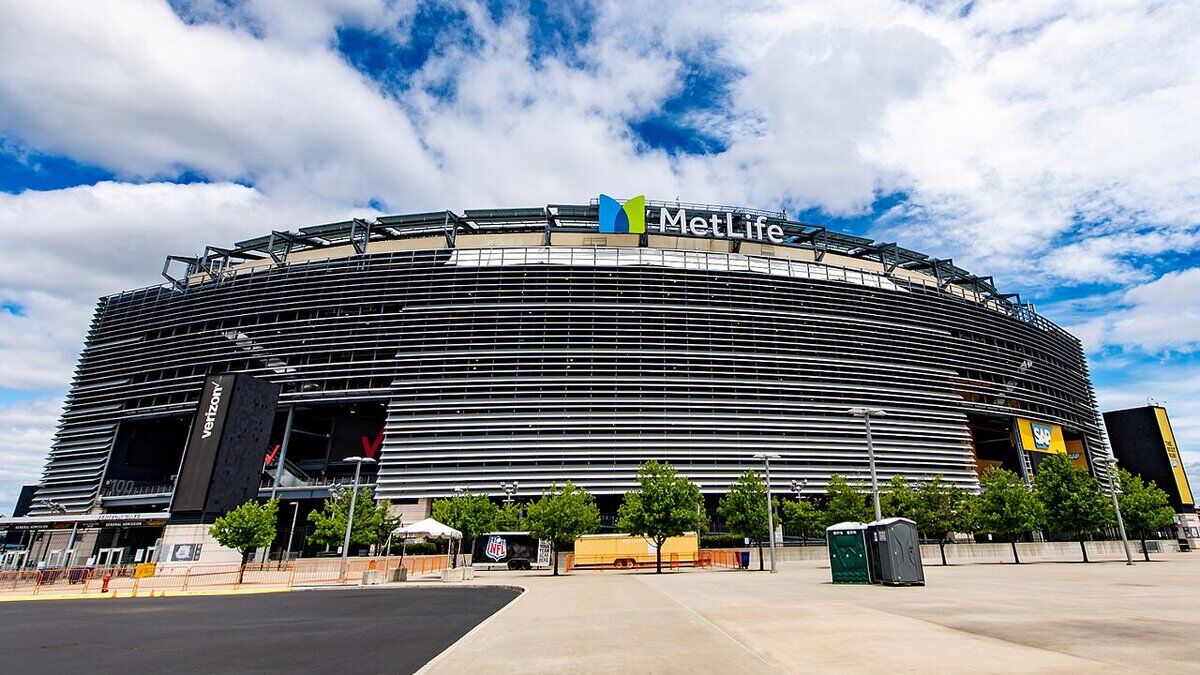
Spain's 19 July win at MetLife Stadium closed the biggest World Cup ever, with 6.81 million fans across 104 matches. Hotel data shows record rates in New York and Dallas but falling occupancy elsewhere, as Hilton credits the tournament for stronger Q3 guidance.
Cover image: MetLife Stadium in East Rutherford, New Jersey, the venue that hosted the 2026 FIFA World Cup final between Spain and Argentina on 19 July 2026. — photo by Thecoolone1223, CC BY 4.0, via Wikimedia Commons.
Spain's 1-0 extra-time victory over Argentina at MetLife Stadium on 19 July closed the largest FIFA World Cup ever staged — and opened the books on whether the tournament delivered the tourism windfall its 16 North American host cities were promised. The final drew 80,663 spectators in East Rutherford, New Jersey, capping total tournament attendance of 6,810,966 across 104 matches at an average of 99.7 per cent of stadium capacity, according to FIFA figures — the highest aggregate attendance in World Cup history.
Ten days on, the tourism scorecard is decidedly mixed. Data from CoStar, parent of hotel benchmarking firm STR, shows US revenue per available room (RevPAR) rose 5.2 per cent in the week ending 11 July — occupancy 67.6 per cent, average daily rate (ADR) up 4.5 per cent to $166.04 — accelerating to 6.3 per cent growth in the week of the final. But analysts describe the tournament as a rate event rather than an occupancy event: room prices soared while several host cities actually sold fewer rooms than last summer. Hilton, meanwhile, became the first major hotel group to bank the effect, citing World Cup demand as it raised guidance on 28 July.
How big was the World Cup 2026 tourism boost?
At national level, the lift was real but concentrated. CoStar data for the week ending 11 July showed World Cup quarter-finals driving the largest market gains: Miami's ADR jumped 37.6 per cent to $232.47 around the England–Norway match, Boston's rose 21.8 per cent to $279.21 for France–Morocco, and Detroit posted the top 25's biggest occupancy gain, up 9.3 per cent to 70.2 per cent.
The final week was stronger still. For the seven days ending 18 July, US occupancy reached 72.4 per cent (up 1.1 percentage points year on year), ADR climbed 5.2 per cent to $174.49 and RevPAR rose 6.3 per cent to $126.33, per CoStar. The closing stages compounded a strong US travel month that opened with record Independence Day air traffic and a knockout-stage travel surge across host markets.
Which host cities won the hotel battle?
New York was the runaway winner. In the week of the final, the market's ADR surged 41.5 per cent year on year to $425.03 and RevPAR leapt 40.3 per cent to $377.07 — the largest gains among the top 25 US markets, according to CoStar. On 18 July, the night before the final, New York ADR jumped 105.1 per cent and RevPAR 116.1 per cent.
Washington, D.C. recorded the largest occupancy gain of the final week among the top 25 markets, reaching 78.3 per cent, while Dallas — host of a semi-final and FIFA's International Broadcast Centre — posted the second-largest RevPAR gain, up 26.6 per cent to $96.81.
| Market (week ending 18 July) | Occupancy | ADR (YoY) | RevPAR (YoY) |
|---|---|---|---|
| New York City | — | $425.03 (+41.5%) | $377.07 (+40.3%) |
| Washington, D.C. | 78.3% | — | — |
| Miami | — | $212.74 (+26.7%) | — |
| Dallas | — | $144.41 (+21.5%) | $96.81 (+26.6%) |
| United States (all markets) | 72.4% | $174.49 (+5.2%) | $126.33 (+6.3%) |
Source: CoStar/STR weekly data, week ending 18 July 2026.
Why did occupancy fall in some World Cup host cities?
Beneath the headline rates sits a displacement story. An analysis of STR data by hospitality consultancy Freewyld Foundry found occupancy down year on year in every host city it tracked during the tournament's early weeks — by 10 to 15 percentage points in most markets. Kansas City ran at 43 per cent occupancy against 58 per cent a June earlier, Houston at 40 per cent versus 51 per cent, and Vancouver at 43 per cent versus 59 per cent — even as ADRs in those markets rose by $100 to more than $230 a night.
The International Business Times reached a similar conclusion: only two of the 11 US host cities — San Francisco and Dallas — recorded net occupancy gains over the tournament. Kansas City logged the largest US decline at 24 per cent, ahead of Seattle (down 15 per cent) and Atlanta (down 13 per cent), while Vancouver fell 20.9 per cent and Toronto 12.4 per cent. Analysts argue regular leisure and business travellers simply avoided host cities, wary of crowds, road closures and inflated prices — a pattern consistent with the pre-tournament forecasts of a concentrated, match-day-driven impact. The upshot: hotels made substantially more revenue on fewer occupied rooms, a dynamic explained in our guide to how hotel room pricing works.
What did the World Cup mean for airline capacity?
Carriers built bespoke schedules around the fixture list. United Airlines added more than 75 extra flights to its summer 2026 schedule serving the 16 host cities. American Airlines layered in over 27,000 additional seats, including a pop-up Atlanta–Kansas City nonstop for the quarter-final round, while Delta boosted frequencies into Los Angeles, New York and Miami.
Pre-tournament industry estimates put World Cup-related air travel across North America at around five million passengers, layered on top of an already record US summer flying period.
What is Hilton saying about the World Cup effect?
Hilton Worldwide gave the tournament its first formal earnings endorsement on 28 July. The group reported second-quarter system-wide RevPAR growth of 3.9 per cent and adjusted EBITDA of $1.054 billion, ahead of guidance, and raised its full-year comparable RevPAR outlook to 3–3.5 per cent from 2–3 per cent, according to Hotel Business.
Crucially, Hilton guided to third-quarter RevPAR growth of approximately 4 per cent, its outlook explicitly flagging World Cup benefits alongside favourable calendar shifts. "We delivered strong top- and bottom-line results for the second quarter, driven by the continuation of strengthening demand trends," said president and chief executive Christopher Nassetta.
Frequently asked questions
Did the 2026 World Cup increase hotel occupancy in host cities?
Mostly not. STR data analysed by Freewyld Foundry and International Business Times reporting show occupancy fell in nine of 11 US host cities versus summer 2025, with only San Francisco and Dallas posting net gains. Hotels profited instead from sharply higher match-night rates.
Which city gained most from the World Cup final?
New York. In the week of the 19 July final at MetLife Stadium, ADR rose 41.5 per cent year on year to $425.03 and RevPAR 40.3 per cent to $377.07, per CoStar; on the eve of the match, rates more than doubled.
How many people attended the 2026 World Cup?
FIFA figures put total attendance at 6,810,966 across the expanded 48-team, 104-match tournament — an average of 65,490 per match at 99.7 per cent of capacity, the highest aggregate of any World Cup.
Will the tourism boost carry into the rest of 2026?
Partially. Hilton expects roughly 4 per cent third-quarter RevPAR growth with the World Cup a named contributor, and has raised full-year guidance — but the rate-driven spike was expected to normalise through August as fans departed.
Sources
- Asian Hospitality — CoStar: New York and D.C. lead US hotel growth in final week
- Hotel Business — Hilton reports 3.9% RevPAR growth in Q2
- Freewyld Foundry — World Cup 2026 STR Occupancy: Real Data From Every Host City
- International Business Times — The World Cup Was Not A Win For Most Cities
- Yahoo Sports/USA Today — Record 2026 World Cup attendance numbers revealed
Related coverage
 Europe's Summer of Strikes: French ATC Walkout Grounds 1,500 Flights as Italy and Spain Join In
07 Jul 2026
Europe's Summer of Strikes: French ATC Walkout Grounds 1,500 Flights as Italy and Spain Join In
07 Jul 2026
 World Cup 2026 Knockout Rounds Trigger a Concentrated Travel Surge as the MetLife Final Nears
06 Jul 2026
World Cup 2026 Knockout Rounds Trigger a Concentrated Travel Surge as the MetLife Final Nears
06 Jul 2026
 Japan's Tourism Boom Sets New Records in 2026 Despite China's Travel Freeze
06 Jul 2026
Japan's Tourism Boom Sets New Records in 2026 Despite China's Travel Freeze
06 Jul 2026


Post a comment